Dashboard
Station ships with a real-time monitoring dashboard. It connects to your signal and broadcast adapters and gives you a web interface for inspecting runs, browsing history, triggering signals, and watching broadcast DAG execution as it happens. It is included in the station-kit package.
Quick start
Install station-kit and an adapter.
pnpm add station-kit station-adapter-sqliteCreate a station.config.ts in your project root.
// station.config.tsimport { defineConfig } from "station-kit";import { SqliteAdapter } from "station-adapter-sqlite";import { BroadcastSqliteAdapter } from "station-adapter-sqlite/broadcast"; export default defineConfig({ port: 4400, signalsDir: "./signals", broadcastsDir: "./broadcasts", adapter: new SqliteAdapter({ dbPath: "./jobs.db" }), broadcastAdapter: new BroadcastSqliteAdapter({ dbPath: "./jobs.db" }), auth: { username: "admin", password: "changeme", },});Start the dashboard.
npx stationThe API server runs on port 4400. The dashboard UI opens on port 4401. Both start automatically.
The auth block is optional but strongly recommended for any non-local deployment. Without it, the dashboard has no login gate.
Login
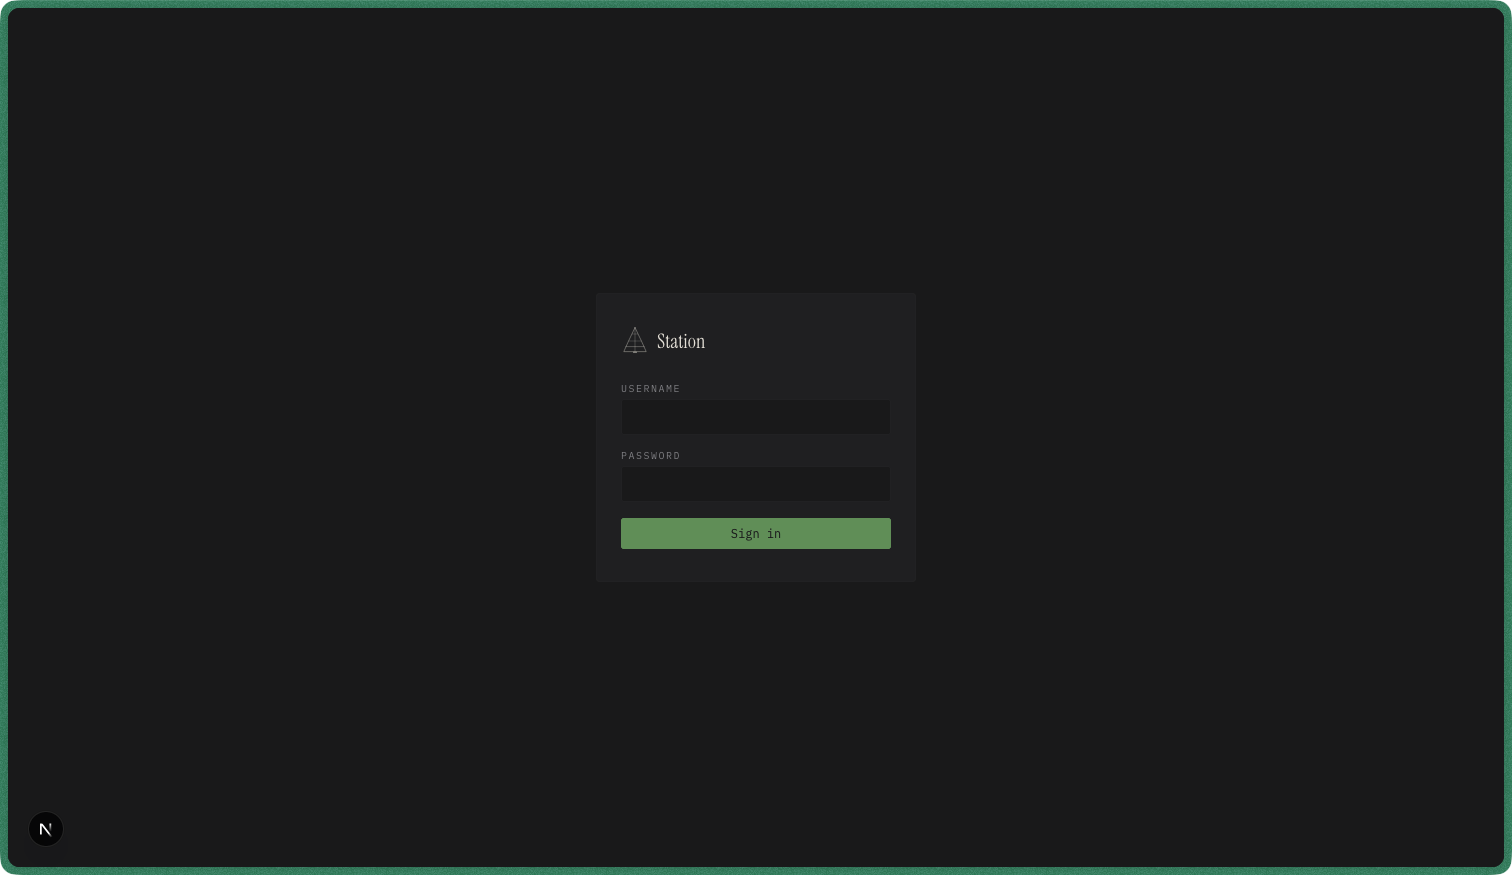
When auth is configured in station.config.ts, the dashboard presents a login screen. Credentials are the plain username and password values from your config file. After sign-in, a session cookie is set. Sessions persist across browser refreshes until the cookie expires or the server restarts.
Overview
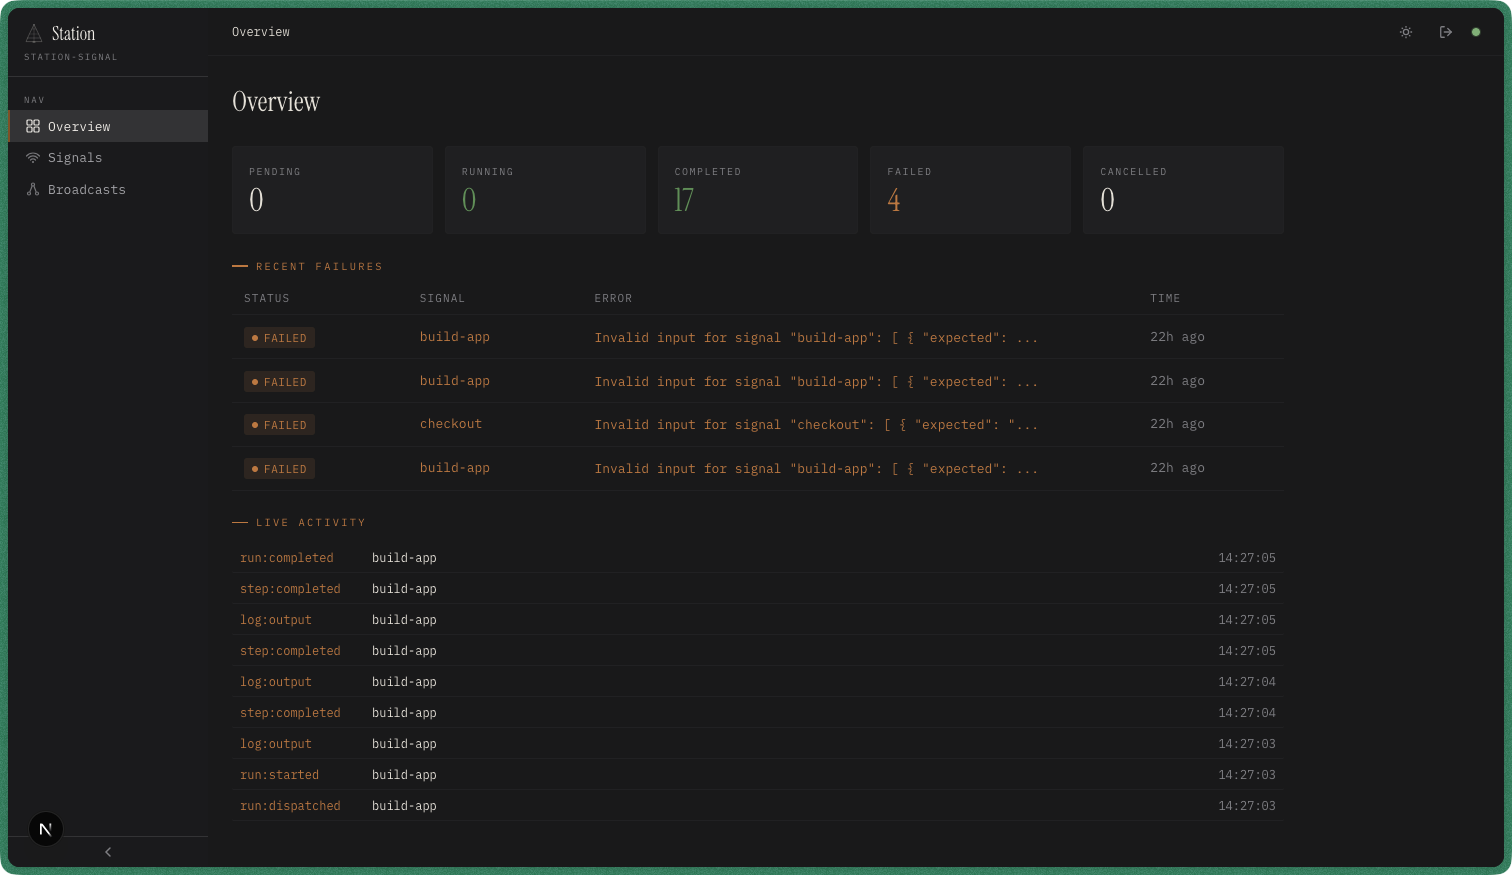
The overview is the landing page after login. It has three sections.
Stat cards at the top show aggregate run counts by status: Pending, Running, Completed, Failed, and Cancelled. These update in real time over the WebSocket connection.
Recent Failures lists the most recent failed runs with status, signal name, error message, and timestamp. Click a row to navigate to the full run detail.
Live Activity is a real-time event feed. Every lifecycle event flows through here as it happens: run dispatched, started, completed, failed, step completions, and log output. The green pulse dot in the header indicates an active WebSocket connection.
Signals
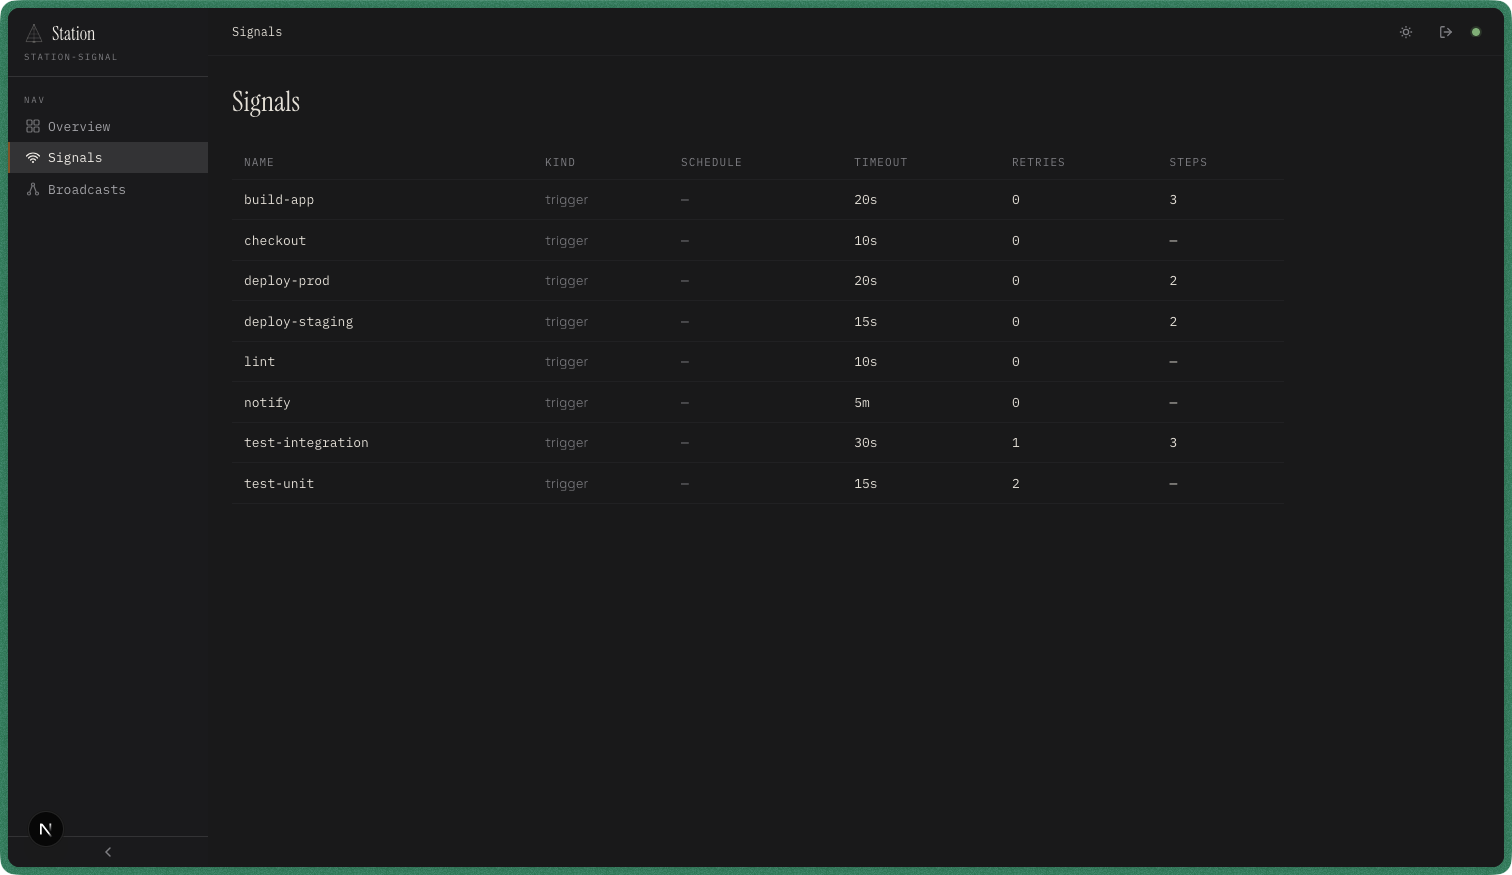
The Signals page lists every registered signal. Columns:
| Column | Description |
|---|---|
| Name | The signal identifier passed to signal(). |
| Kind | Whether the signal uses a single .run() handler or multi-step .step() pipeline. |
| Schedule | The recurring interval if set via .every(), otherwise blank. |
| Timeout | Maximum execution time before the run is killed. |
| Retries | Number of retry attempts after the initial failure. |
| Steps | Number of steps in a multi-step signal. Blank for single-handler signals. |
Click any row to open the signal detail page.
Signal detail
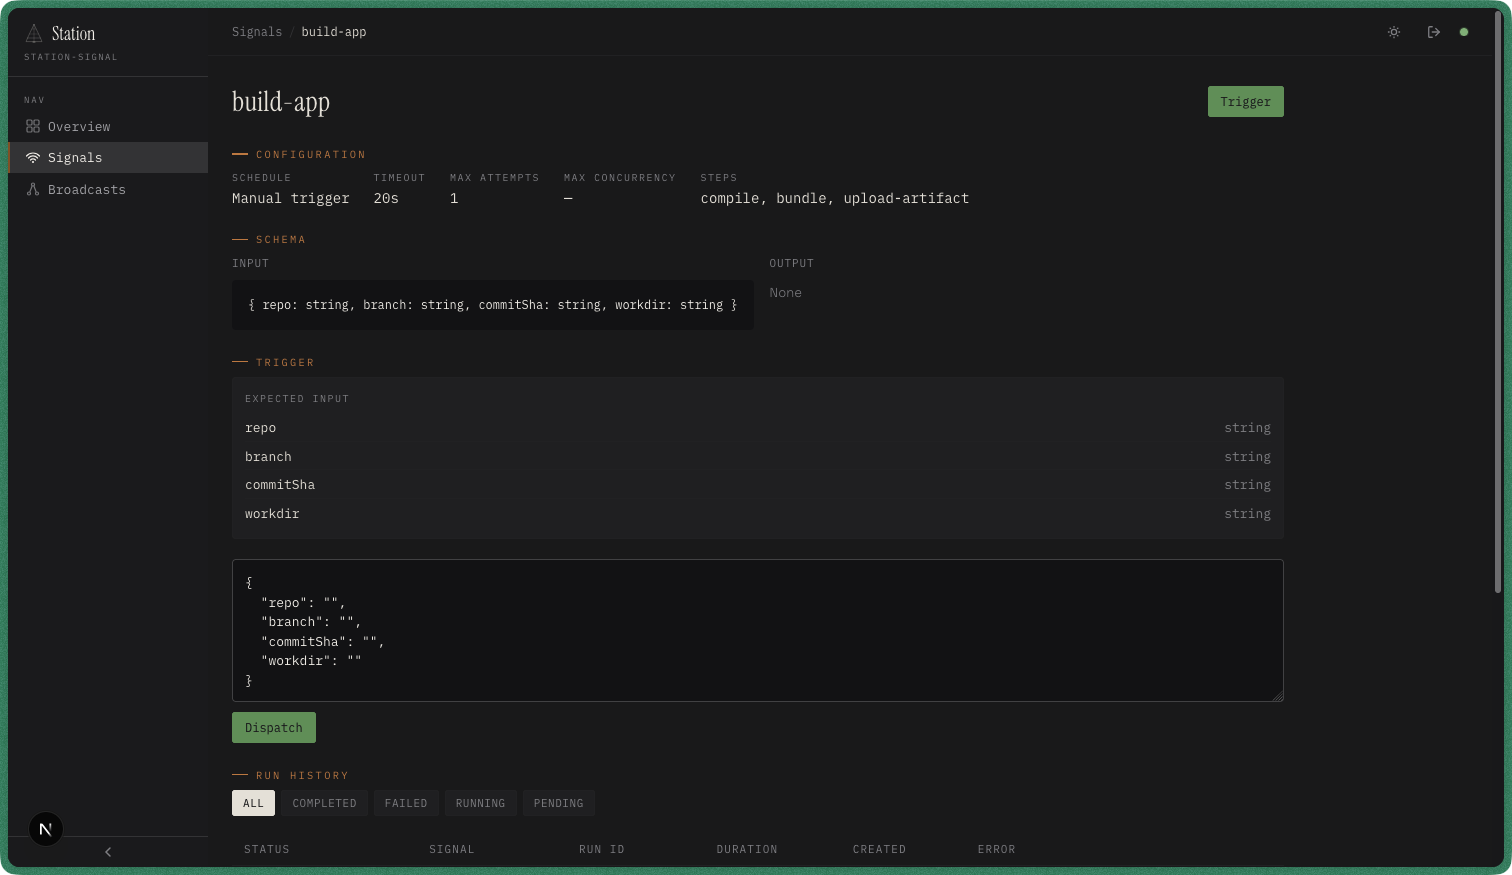
The signal detail page has four sections.
Configuration shows the signal’s settings at a glance: schedule (or “Manual trigger” if no interval), timeout, max attempts, max concurrency, and the list of step names for multi-step signals.
Schema displays the Zod input and output schemas rendered as field lists with types. This is generated directly from the .input() and .output() definitions in your signal file.
Trigger lets you dispatch the signal manually. The form pre-populates fields from the input schema. You can also switch to a raw JSON editor for complex payloads. Press Dispatch to enqueue a new run.
Run History at the bottom lists all runs for this signal. Use the filter tabs (All, Completed, Failed, Running, Pending) to narrow the view.
Run history
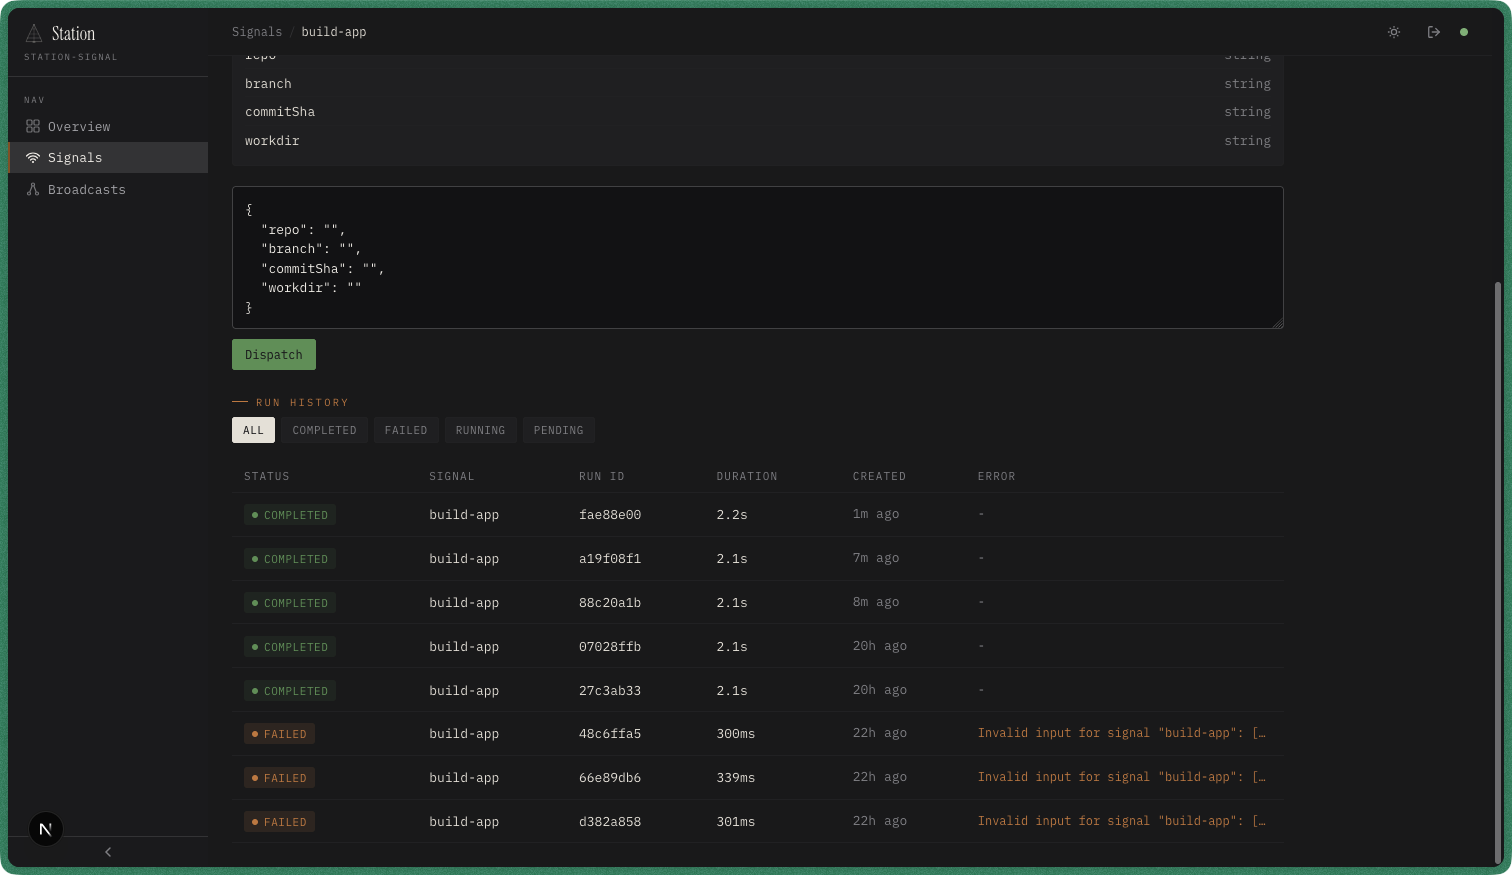
The run history table shows every execution for the current signal. Each row displays:
- Status — color-coded badge (green for completed, red for failed, yellow for running, gray for pending or cancelled)
- Signal — the signal name
- Run ID — unique identifier for this execution
- Duration — wall-clock time from start to finish
- Created — when the run was enqueued
- Error — error message if the run failed
Click any row to open the full run detail with input, output, logs, and step records.
Broadcasts
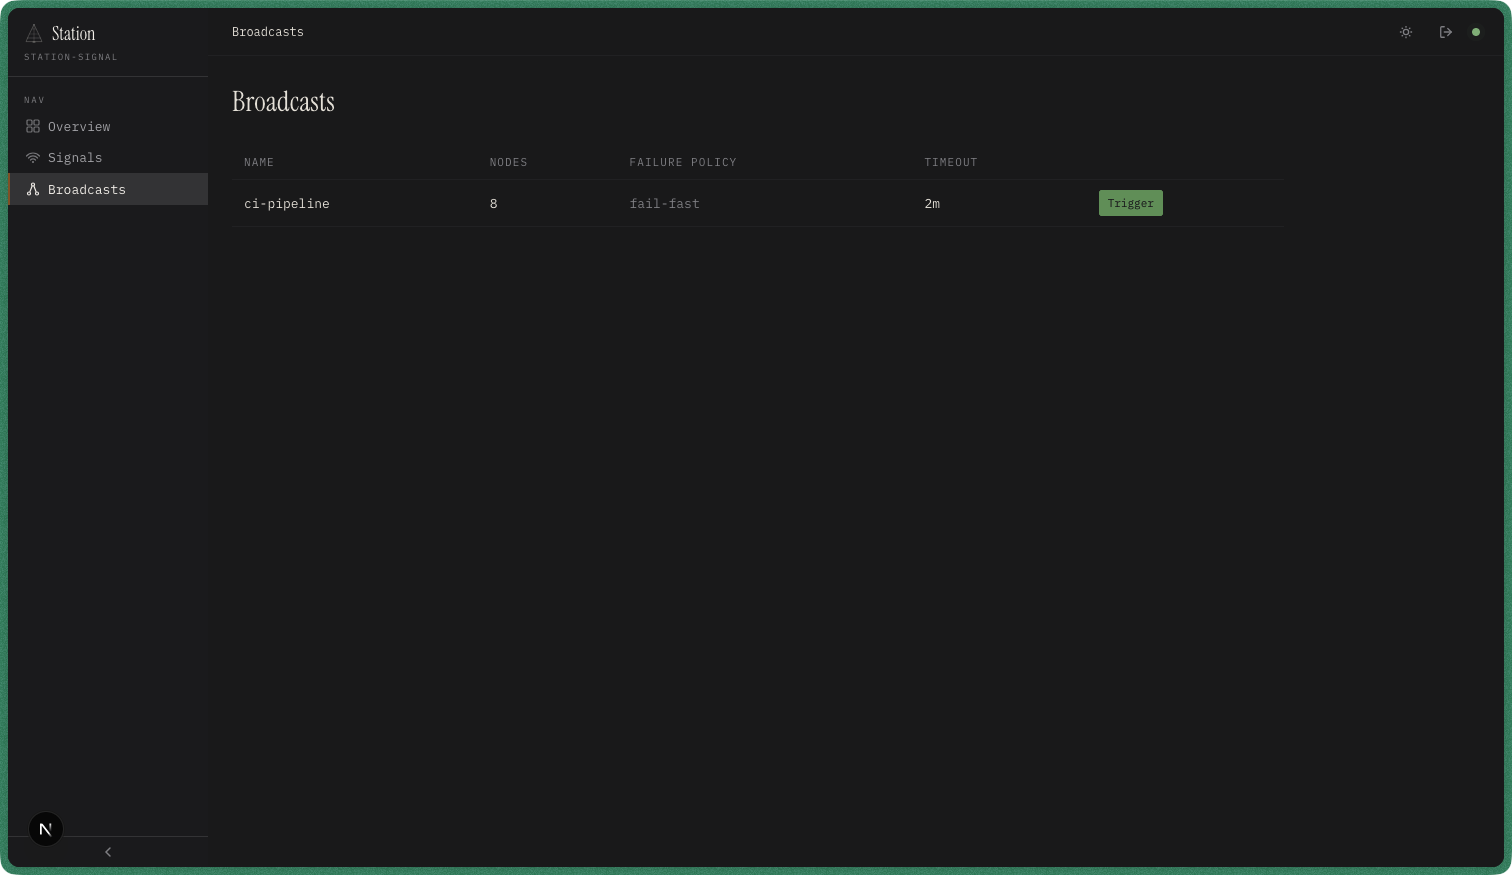
The Broadcasts page lists every registered broadcast. Columns:
| Column | Description |
|---|---|
| Name | The broadcast identifier passed to broadcast(). |
| Nodes | Total number of nodes in the DAG. |
| Failure Policy | How failures propagate: fail-fast (abort on first failure) or continue (run remaining nodes). |
| Timeout | Maximum wall-clock time for the entire broadcast execution. |
The green Trigger button dispatches a broadcast run directly from the list. Click the row to open the broadcast detail.
Broadcast detail
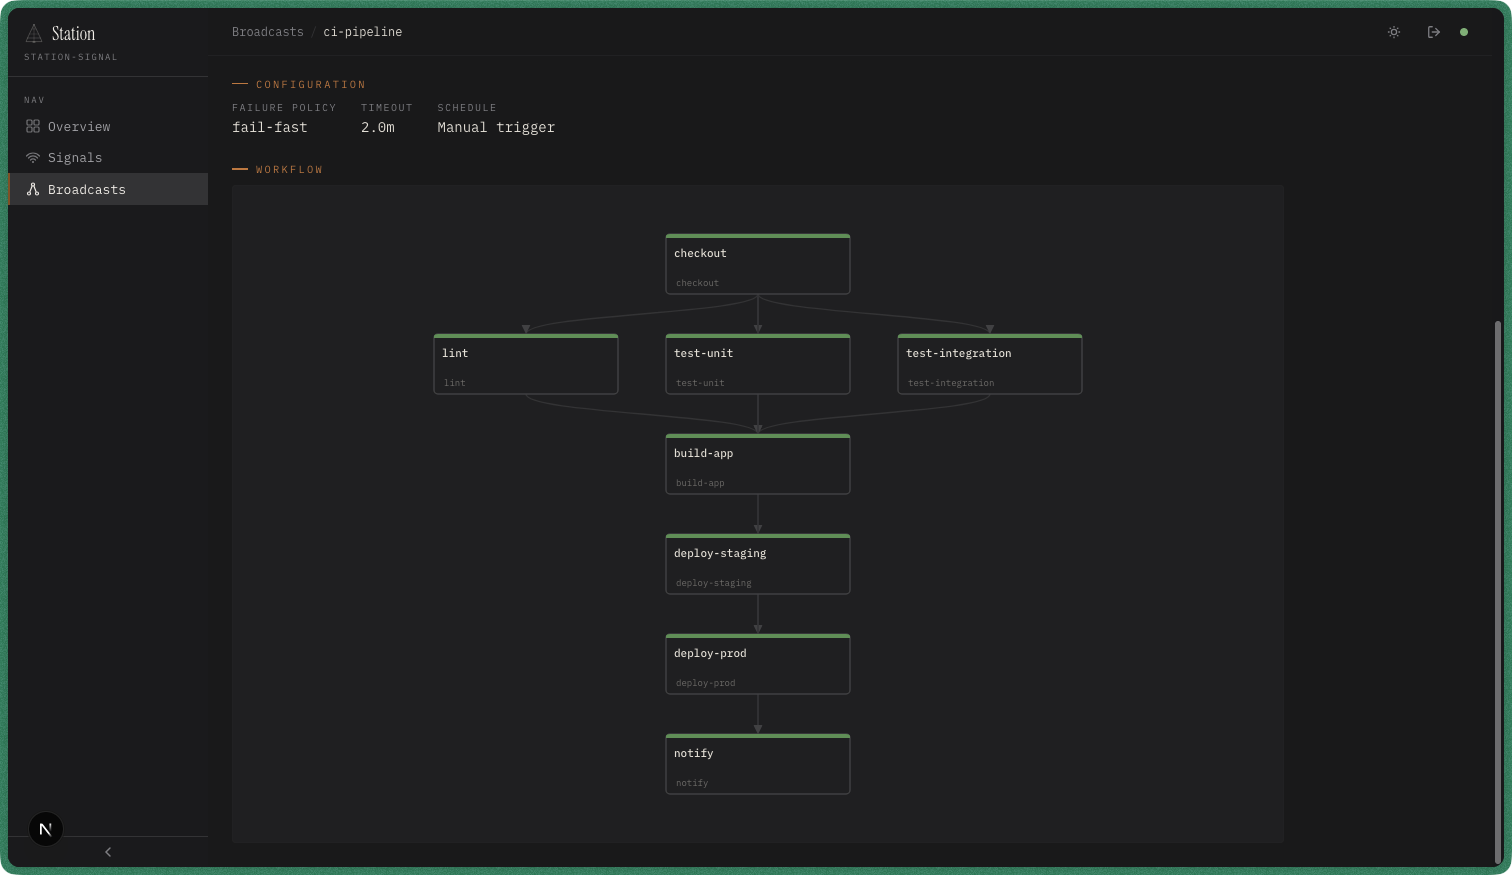
The broadcast detail page shows the full DAG structure.
Configuration displays the failure policy, timeout, and schedule at a glance.
Workflow renders the DAG as an interactive graph. Each node maps to a signal. Arrows represent dependency edges — a node only executes after all its upstream dependencies complete. In the example above, checkout must finish before lint, test-unit, and test-integration can start in parallel. Then build-app waits for all three before continuing the pipeline through deployment and notification.
Broadcast run
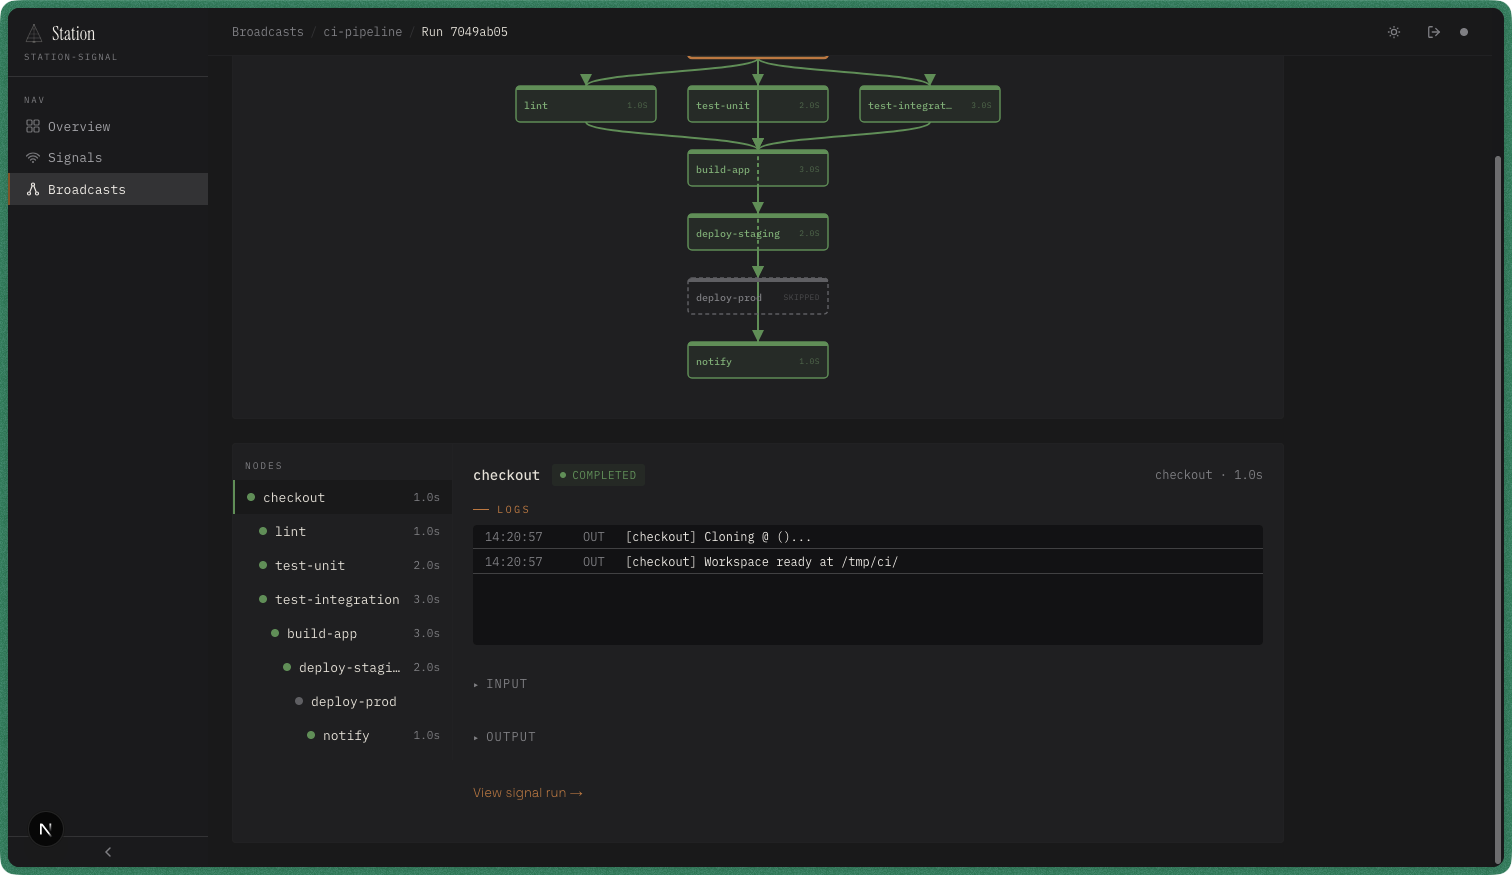
When a broadcast executes, the run detail page provides a live view of the DAG.
Live DAG at the top colors each node by status: green for completed, red for failed, yellow for running, gray for pending or skipped. Duration labels appear on finished nodes.
Nodes sidebar on the left lists every node with a status dot and duration. Click a node to inspect it.
Detail panel on the right shows the selected node’s status, duration, and captured logs with timestamps and log levels. Collapsible Input and Output sections display the data passed into and returned from the node’s signal handler. The “View signal run →” link at the bottom navigates to the underlying signal run for full run-level detail.
Debugging errors
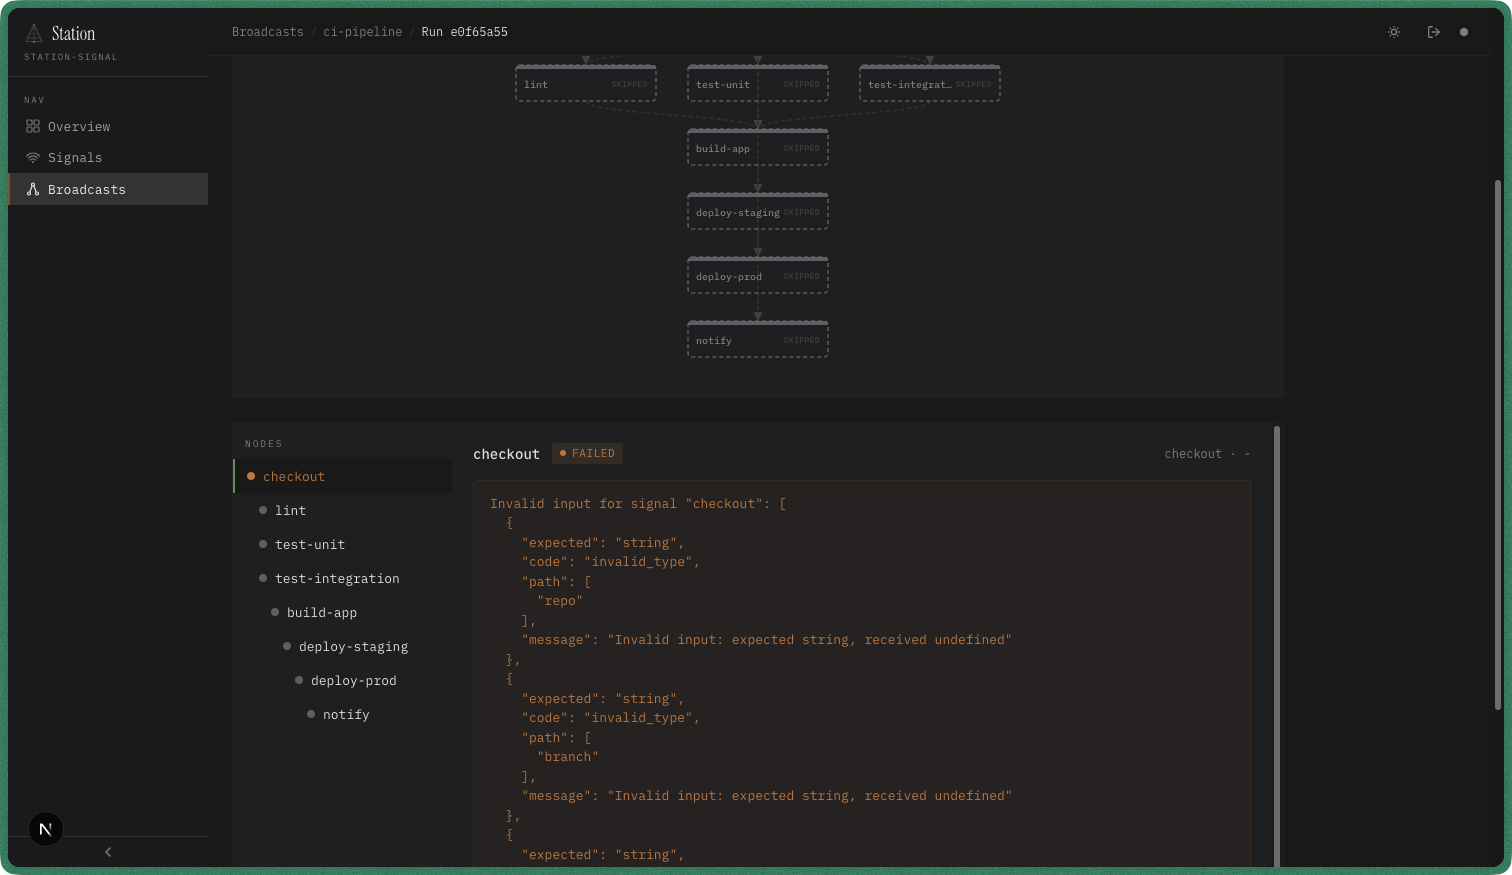
Failed nodes are highlighted in the DAG. Click one to open its detail panel.
The panel shows the full error output, including structured error objects. In the example above, a Zod validation error shows exactly which fields failed and why — “expected string, received undefined” for each missing input field. This makes it straightforward to trace the root cause without leaving the dashboard.
From any failed node, use the “View signal run →” link to jump to the signal run detail page for step-level records, full input/output, and retry history.
Configuration reference
Key options for station.config.ts:
| Option | Type | Default | Description |
|---|---|---|---|
port | number | 4400 | API server port. Dashboard UI runs on port + 1. |
signalsDir | string | — | Path to signal definition files. |
broadcastsDir | string | — | Path to broadcast definition files. |
adapter | SignalQueueAdapter | MemoryAdapter | Signal storage adapter. Must match your runner’s adapter. |
broadcastAdapter | BroadcastQueueAdapter | — | Broadcast storage adapter. |
auth | { username, password, sessionTtlMs? } | — | Dashboard login credentials. sessionTtlMs sets session expiry in milliseconds (default: 86,400,000 / 24 hours). Omit auth entirely to disable auth. |
runRunners | boolean | true | Run signal and broadcast runners internally. Set to false for read-only monitoring. |
See the Station Kit API reference for the complete list of options, API endpoints, and WebSocket events.